Static images in research papers often don't give the reader enough of a 'feel' for the research and I find providing supplementary interactive visualisations helps to convey the message. I create these by exporting volumes and meshes to x3dom and using jquery for added interactivity.
Below are some recent examples with links to the interactive visualisations.
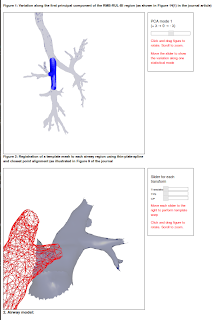
Publication 1:Computer assisted detection of abnormal airway variation in CT scans related to paediatric tuberculosis
(http://www.sciencedirect.com/science/article/pii/S1361841514000887)Supplementary material with interactive visualisations
Publication 2: Automated Colorectal Tumour Segmentation in DCE-MRI using Supervoxel Neighbourhood Contrast Characteristics (MICCAI 2014, accepted)
Supplementary material with interactive visualisations

http://www.birving.com/supplementary/Irving_MICCAI_2014.xhtml